
Cleaner Charts.
More Structured Decisions.
Built to reduce chart clutter and support a more structured trading workflow.
A Unified Trading Workflow
SMRT Algo brings structure, trend, momentum, and liquidity tools together in one coordinated analysis workflow.
Designed To Reduce Noise
Review entry, stop, and target labels alongside the chart conditions that generated them. Compare the displayed levels with your own plan before deciding whether to trade.
5-Factor Confluence
Trend, volatility, momentum, liquidity, and structure work together inside one coordinated analysis workflow.
Flexible Chart Analysis
Use the toolkit on compatible TradingView charts and choose the timeframe and settings that suit your analysis. Available data and functionality vary by chart and indicator.
A Complete Toolkit Built Around Confluence.
Bring trend, momentum, volume, and structure into one chart workflow, with context you can review against your own criteria.
Pro V5 — The Confluence Engine
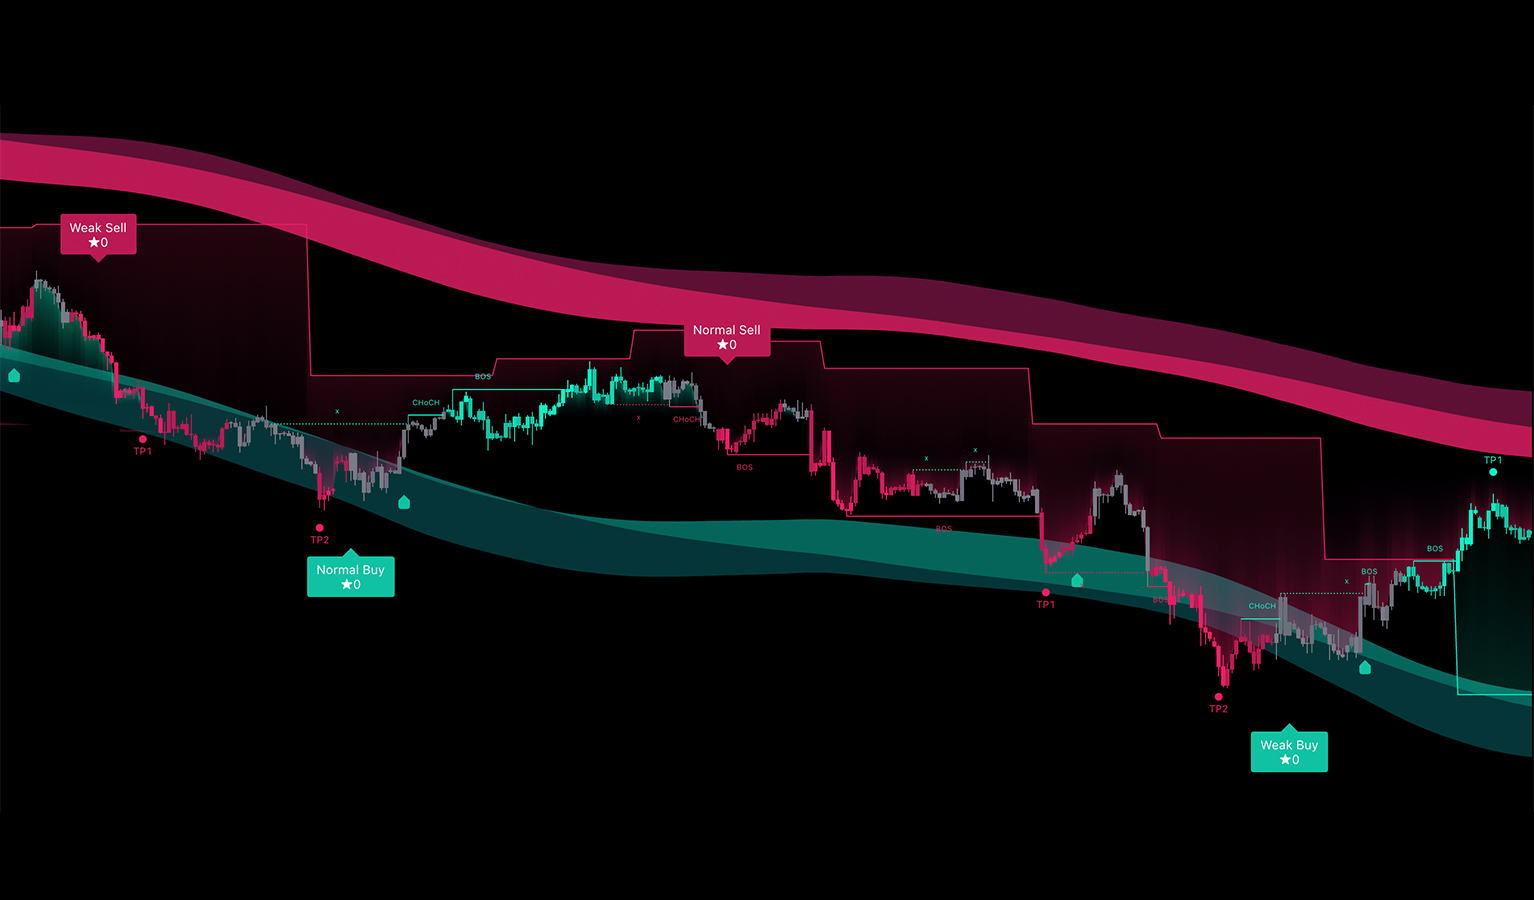
Pro V5 combines trend conditions, structure, volatility, sentiment, and confluence to highlight setups that meet its configured criteria. Review the supporting context alongside entry, stop, and target labels.
- Bullish/bearish bias with strength scoring (★) and volume read
- Multi-stage setup logic — filters → features → main trend → chart labels
- Risk-planning displays — Stop Loss + TP1, TP2, TP3, plus trailing stop & R:R modes
- Multi-timeframe dashboard — 5m, 15m, 30m, 1h, 4h, 1D agreement at a glance
- Optional overlays — Reversal Cloud, Sentiment Cloud, Market Bias ribbon, Pivot Flow trend line
Smart Money Toolkit
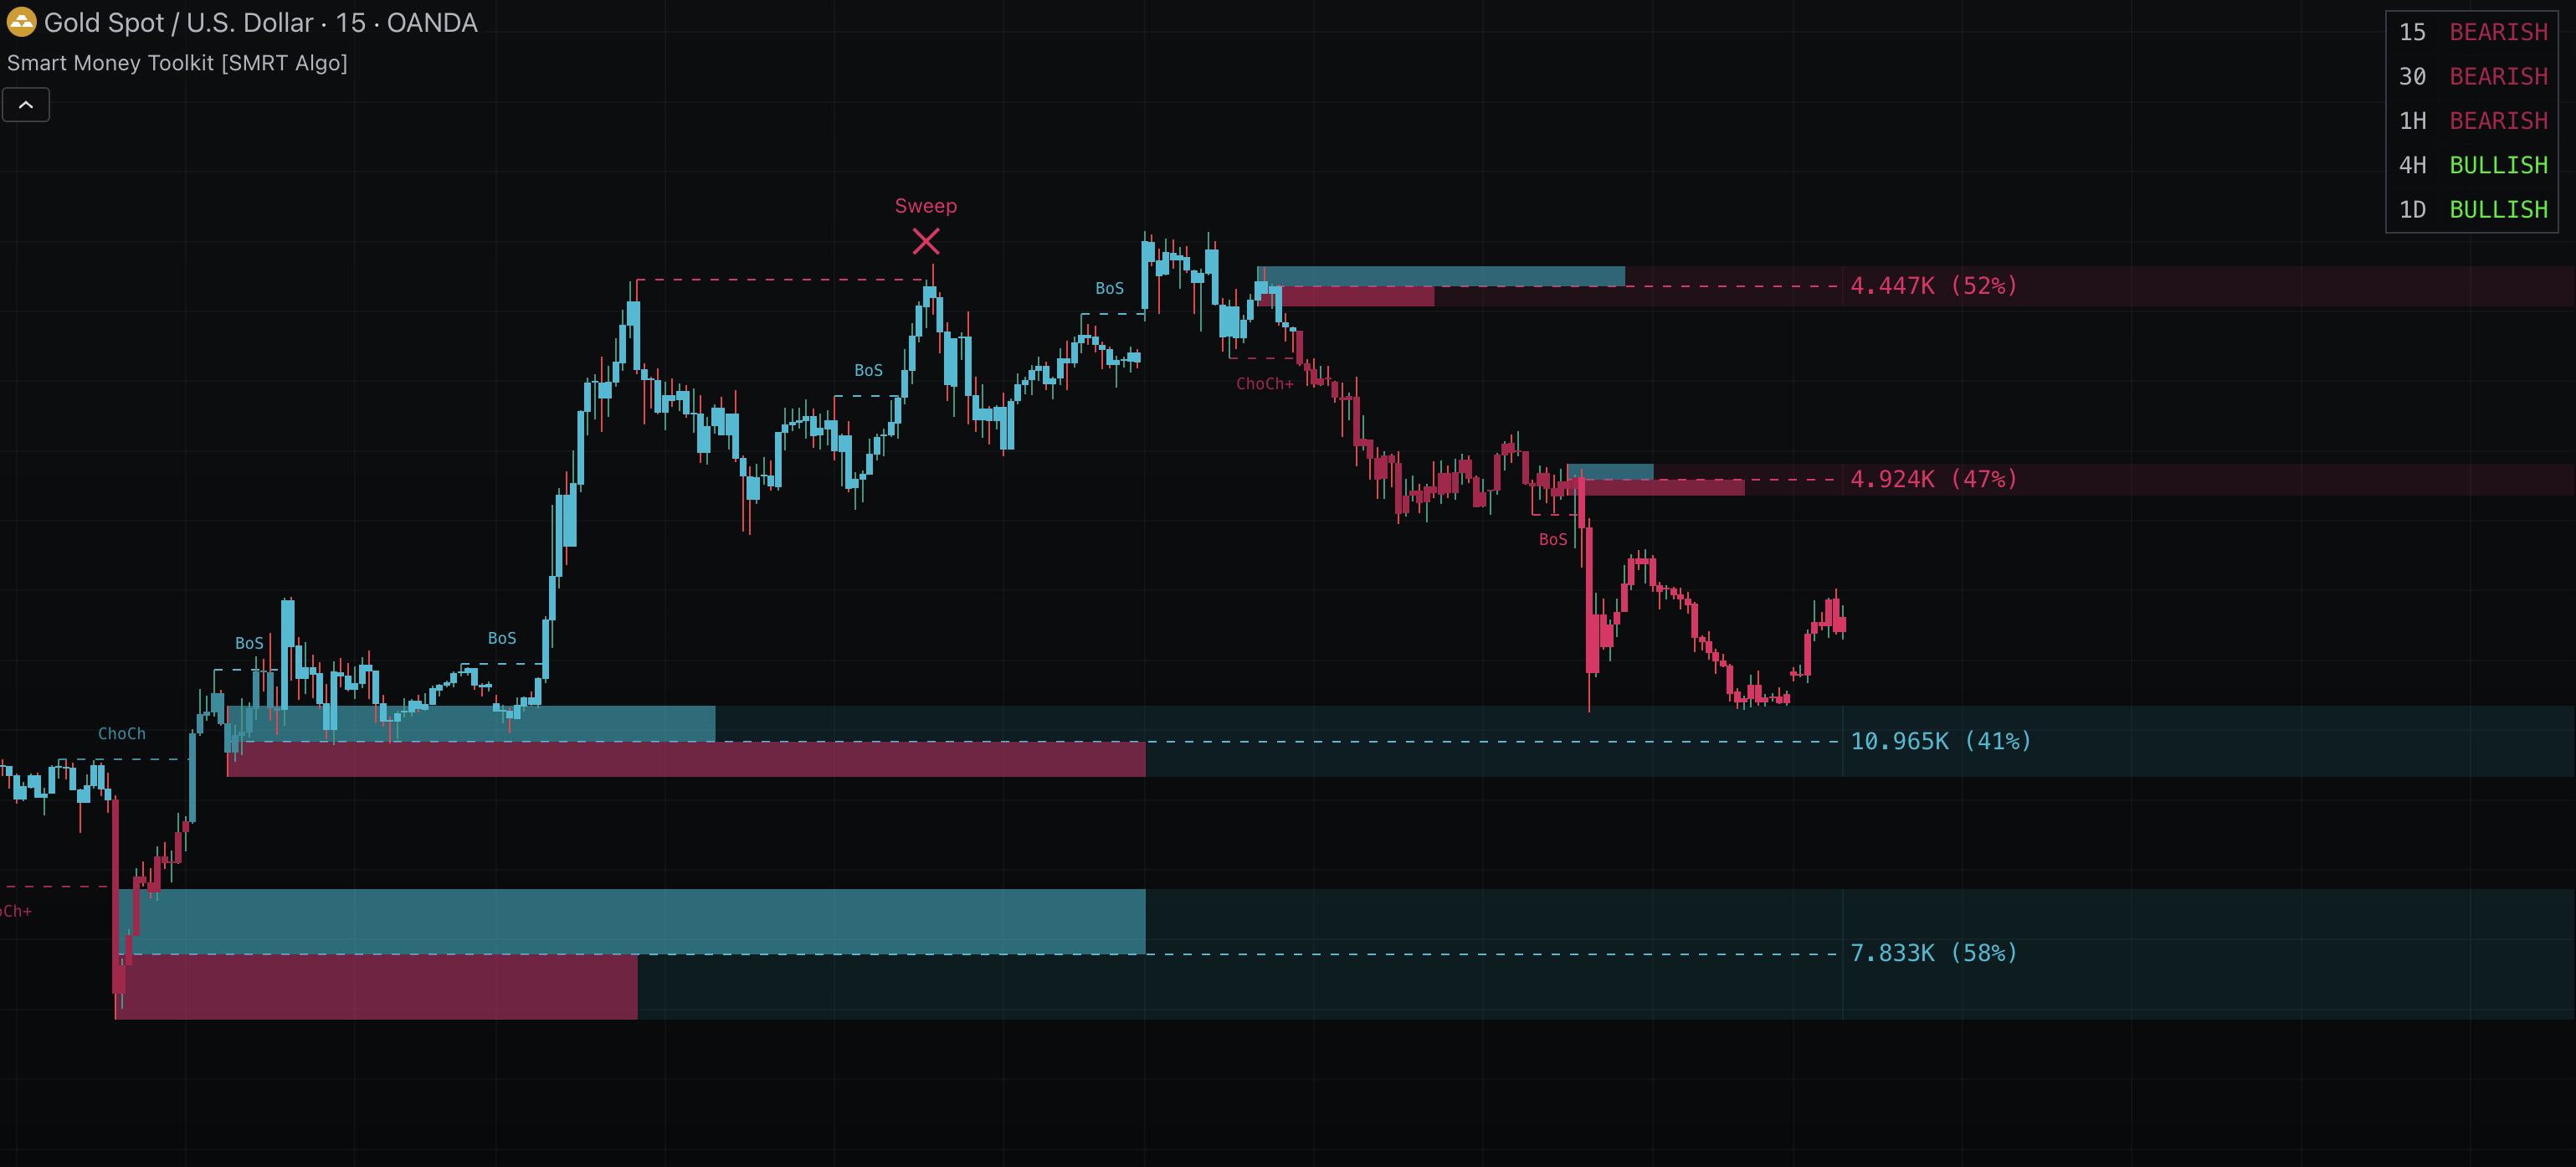
Automatically mark liquidity zones and structure shifts based on price and volume data, reducing the need to draw each level manually.
- Volumetric order blocks — review volume information associated with each zone
- BoS & CoCh on two structural levels — internal (intraday) and swing (HTF)
- Liquidity sweeps auto-marked — review where price has moved beyond prior highs or lows
- Premium / equilibrium / discount zones with strong-vs-weak high/low markers
- Multi-timeframe dashboard — 15m / 1H / 4H / 1D structure at a glance
Multi-Asset Screener
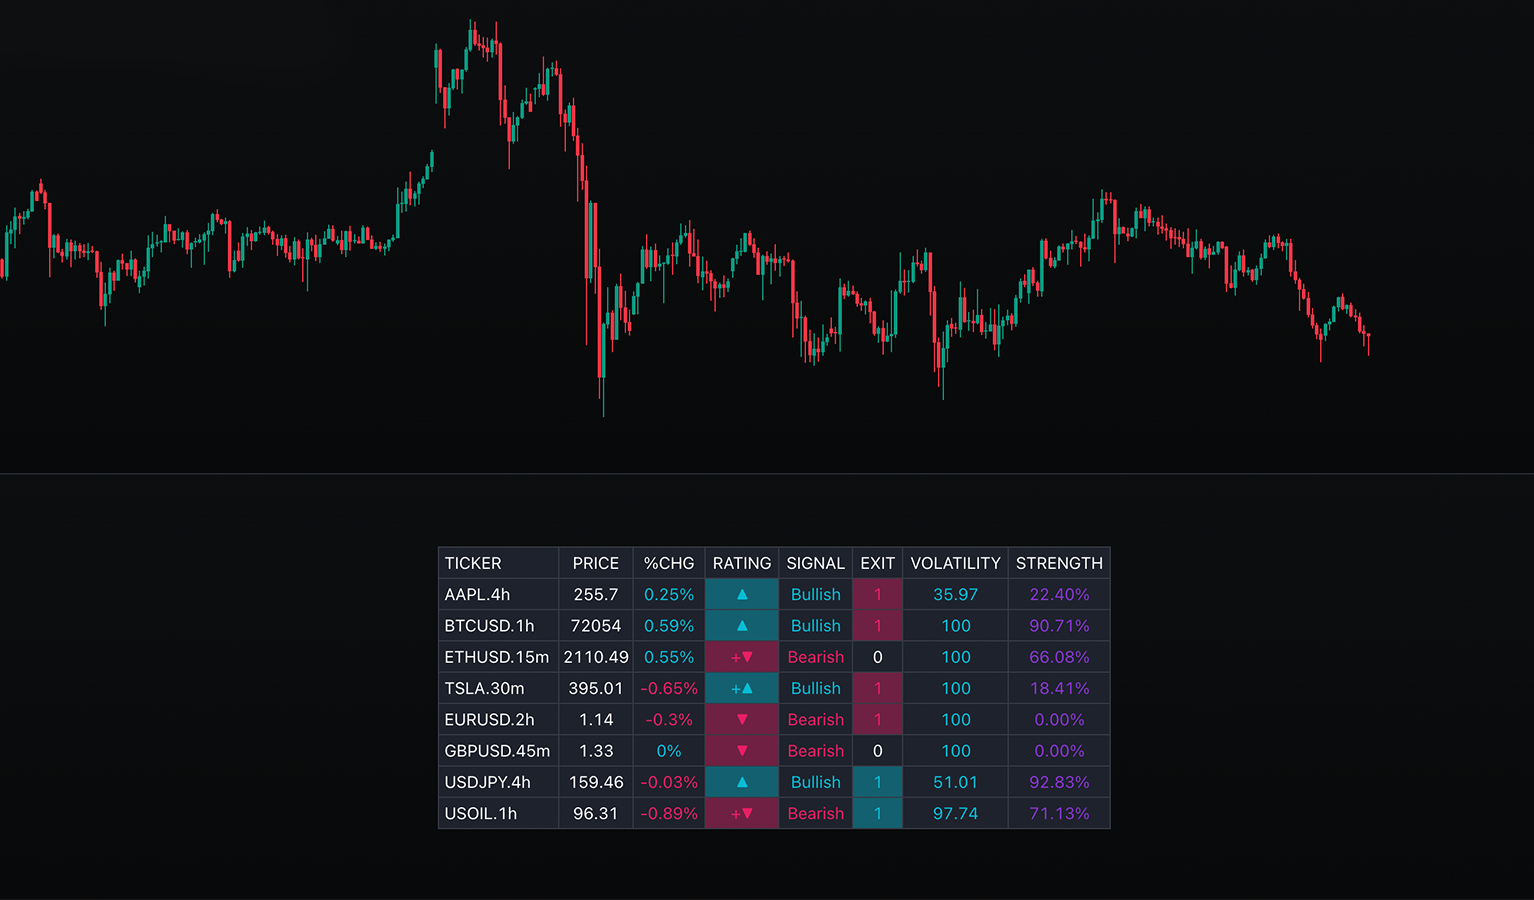
Compare configured chart conditions, trend alignment, and momentum across multiple assets in one dashboard.
- Real-time multi-ticker dashboard with price, price change, rating, entry and exit labels, trend, and structure per row
- Multi-timeframe condition columns — 1m / 5m / 15m / 30m / 1H / 4H / Daily per asset
- Classifier — Basic (scalp), Normal (intraday), Advanced (swing) modes
- Volatility & strength filters — filter the dashboard using your selected thresholds
- Pairs with Pro V4 for chart review — review dashboard conditions in the corresponding chart context
SMRT Volume Profile
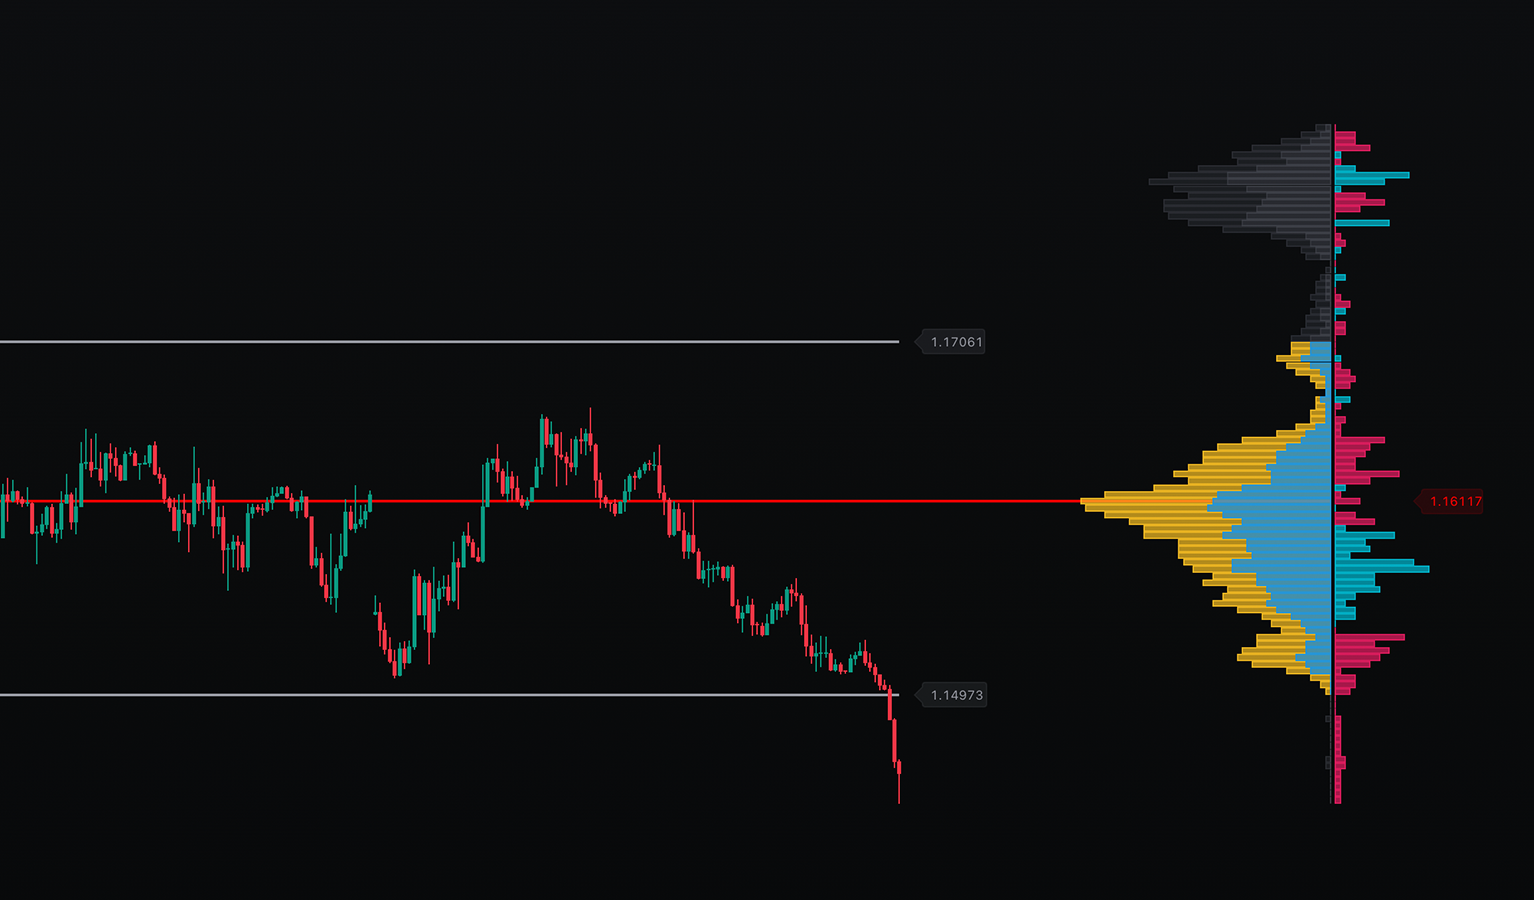
Built to simplify advanced volume analysis, the profile system highlights the structural areas where market participation and liquidity are concentrated.
- Rolling profile — last N candles for active intraday context
- Anchored profile — to a specific candle, session, week, or event
- Composite profile — overlays multiple anchored profiles to surface repeat HVN/POC zones
- Customizable value area — standard 70%, configurable per setup
- POC line rendered as a horizontal level — reference level for the selected volume profile
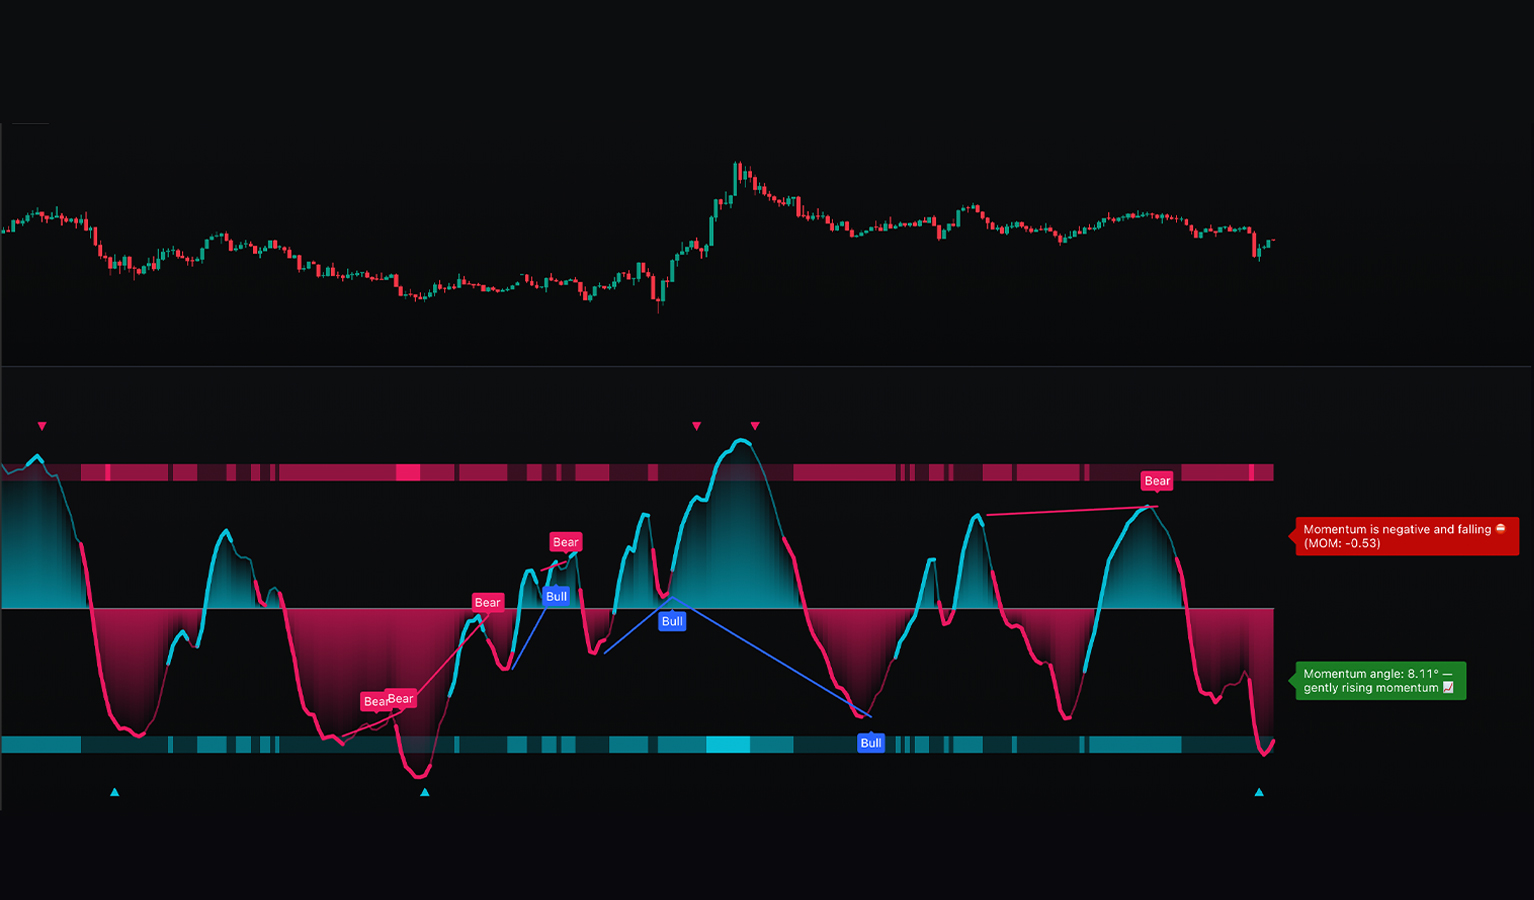
SMRT Oscillator
A WaveTrend-based momentum system enhanced with four engines working together: divergence detection, Heikin Ashi market bias, momentum angle/velocity tracking, and plain-language descriptions of current indicator readings. Reads like a conversation — "Momentum is positive and increasing" — instead of a stack of crossovers.
- Divergence analysis — flags when price and momentum disagree
- Heikin Ashi bias filter for background trend direction
- Momentum angle tracking — slope and acceleration of the curve, not just position
- Real-time text labels — "growing", "slowing", "reversing" interpretations
- Color fills + gradients for instant visual reads of strength and direction
Pro V4 — Multi-Factor Chart Analysis
The previous-generation flagship — and the engine that powers the Multi-Asset Screener under the hood. Multi-factor scoring, Trend Trail, Trend Ribbon, Reversal Channel, and Market Stair structure surfacing — all in one indicator.
- Multi-factor scoring with a composite condition rating
- Trend Trail & Trend Ribbon for bullish/bearish bias confirmation
- Reversal Channel — overbought/oversold zone tracking
- Classifier modes — Basic / Normal / Advanced for scalp through swing
- Pairs natively with the Multi-Asset Screener — same engine, broader view
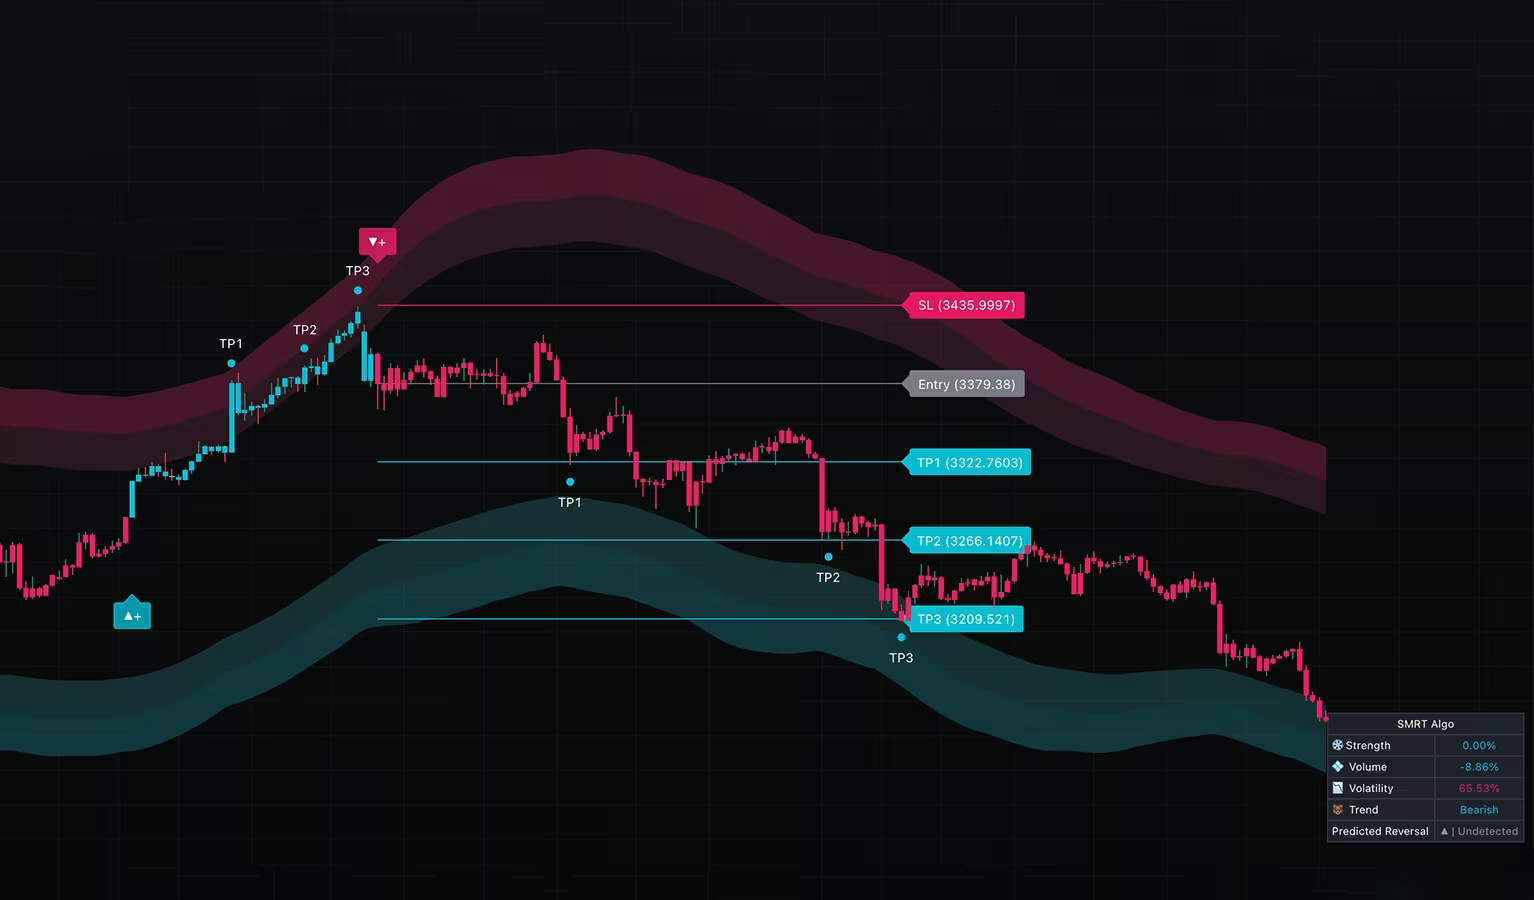
Pro V3 — Structured Trend Analysis
Pro V3 combines directional analysis and simplified confirmation logic to display trend-following setups on compatible charts.
- Trend-aligned entries with simplified confirmation logic
- Selective chart labels — based on configured trend conditions
- Works alongside V4 and V5 as a confluence overlay
- Configurable chart settings — choose compatible data and timeframes
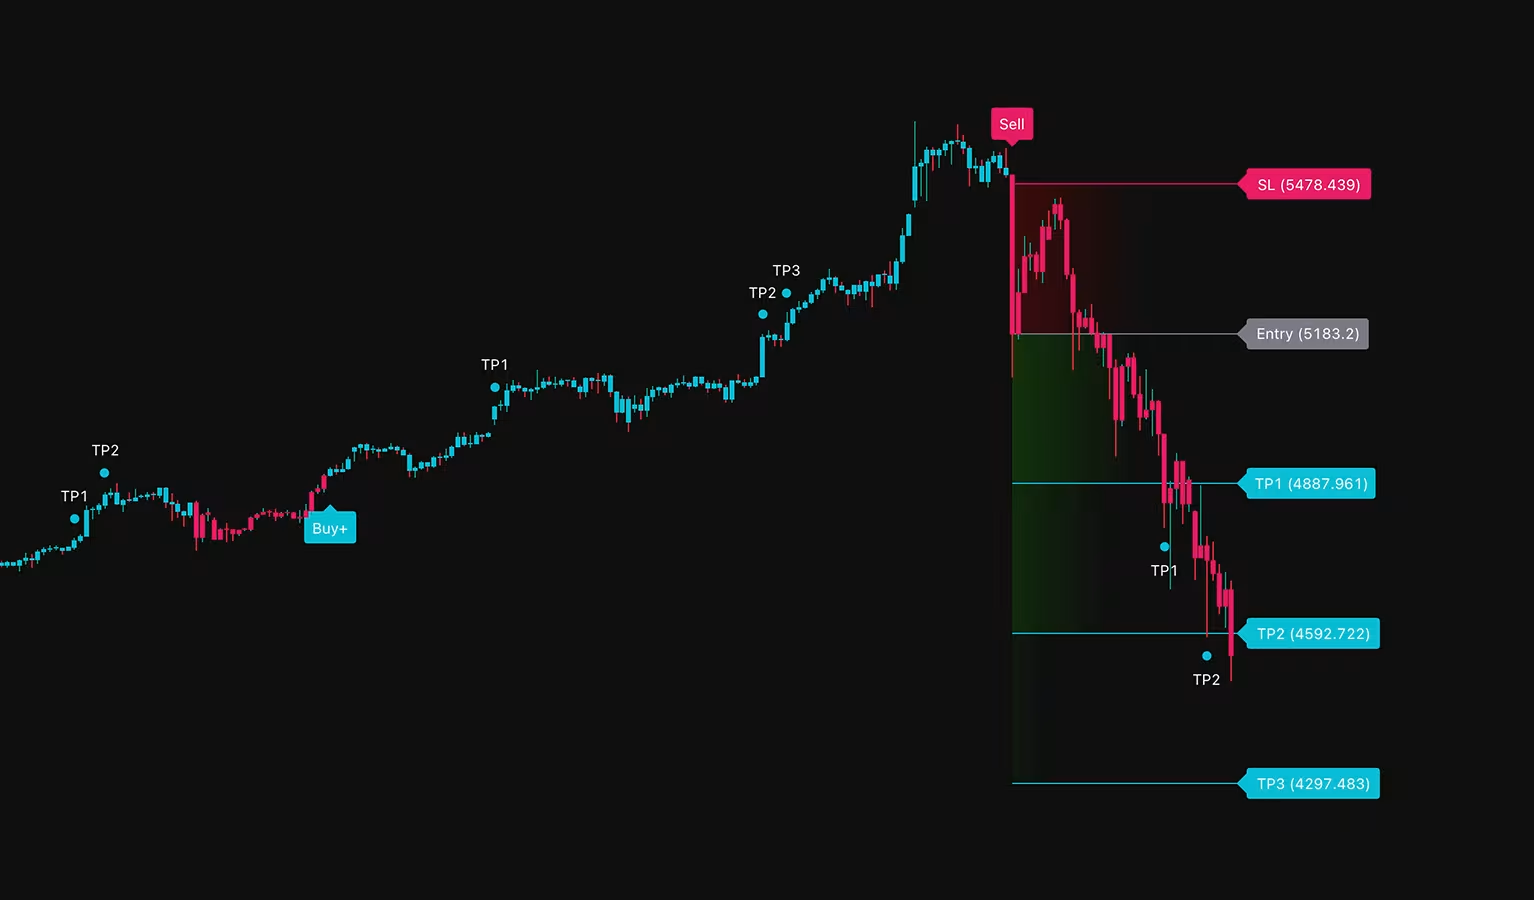
V1 Algo — The Original Chart Toolkit
The original SMRT Algo workflow combines directional filters, confirmation logic, and entry, stop, and target displays in one chart interface.
- Standard chart labels — pullback logic at average price levels
- Additional-condition labels (×) — a second layer of configured conditions
- MA Filter for trend-aligned chart conditions
- Dynamic support & resistance with chart background plotting
- Pre-calculated TP & SL levels alongside setup labels
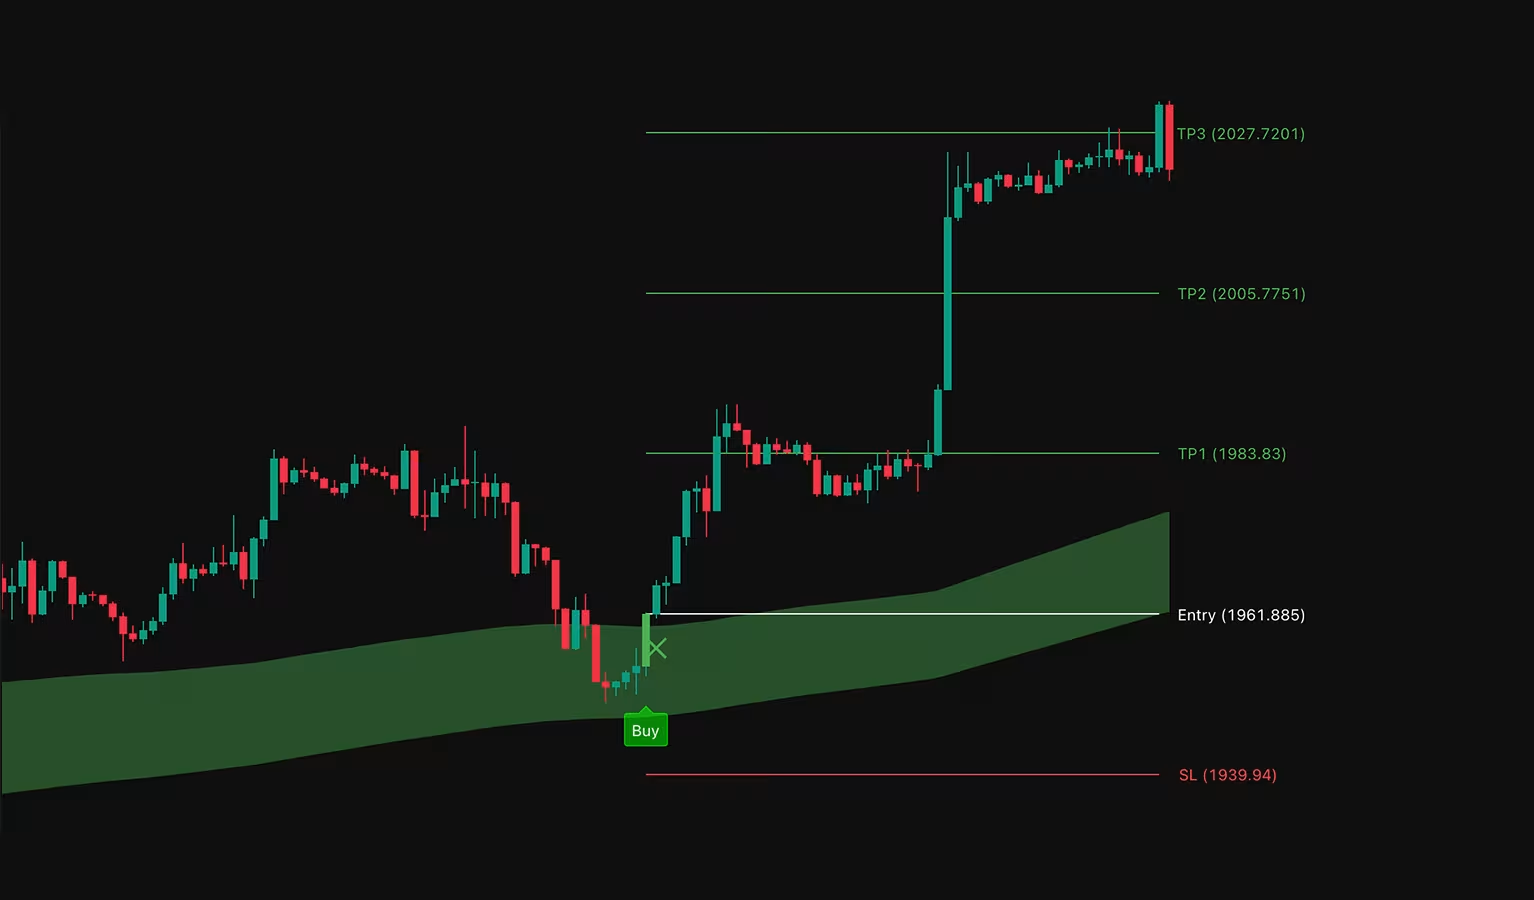
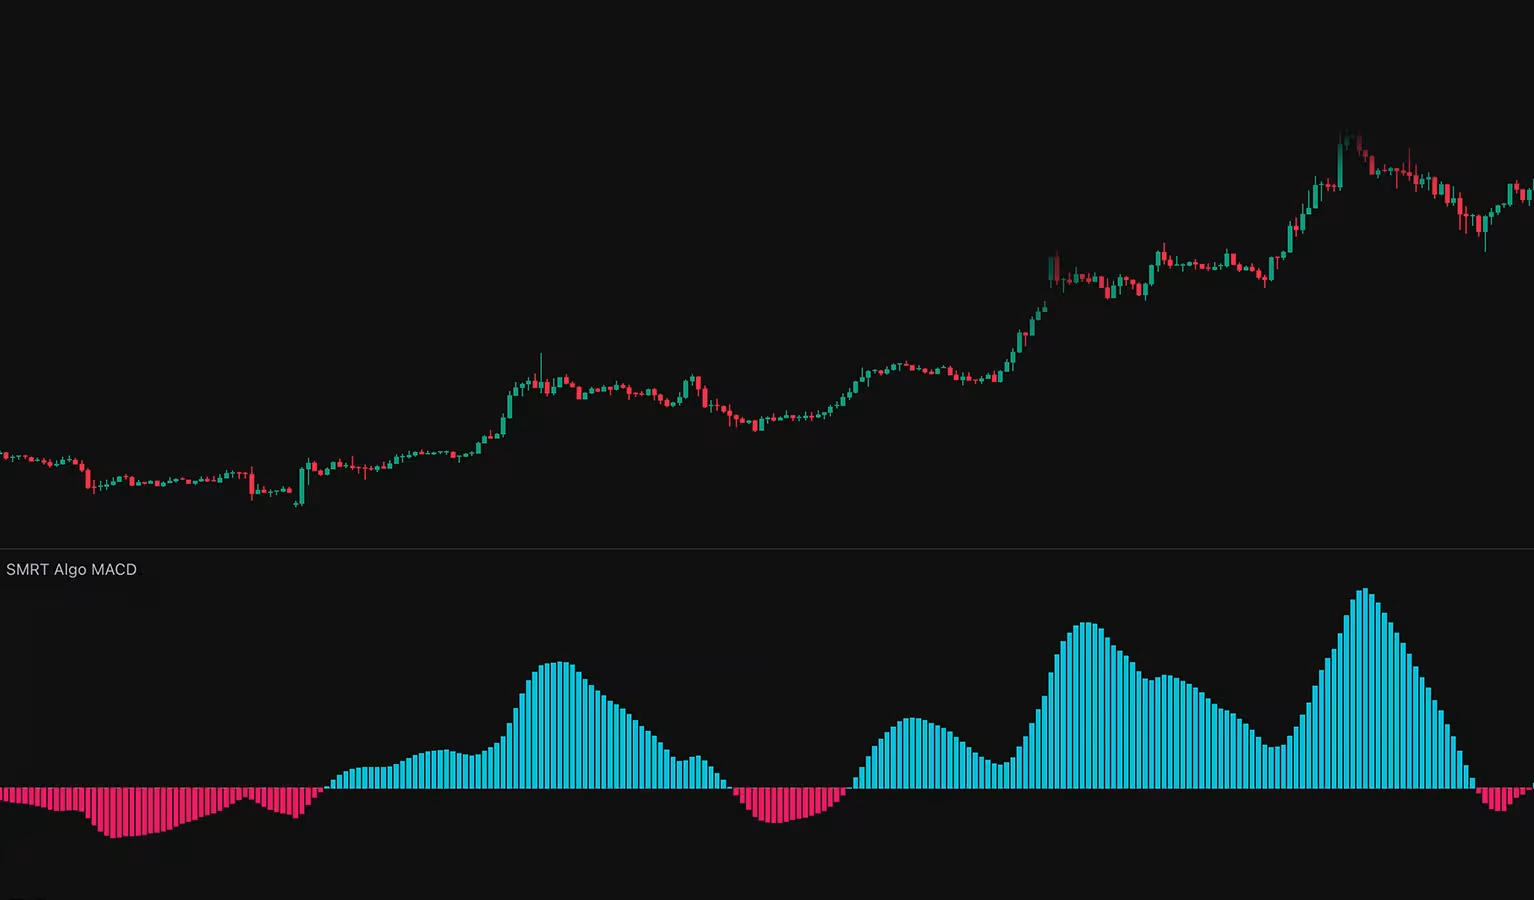
SMRT MACD — Histogram-Focused
A MACD display that uses a smoothed histogram as its primary read. Color changes show shifts in the indicator calculation, giving you a visual reference for reviewing momentum and trend conditions.
- Histogram-focused — no fast/slow MA lines cluttering the chart
- Reduced sensitivity to short-term noise
- Smoothed histogram — color changes based on smoothed momentum readings
- Color-coded bias — blue bullish, red bearish
- Trend context for reviewing short-term counter-trend moves
Swing Algo — Trend-Focused Swing Trading
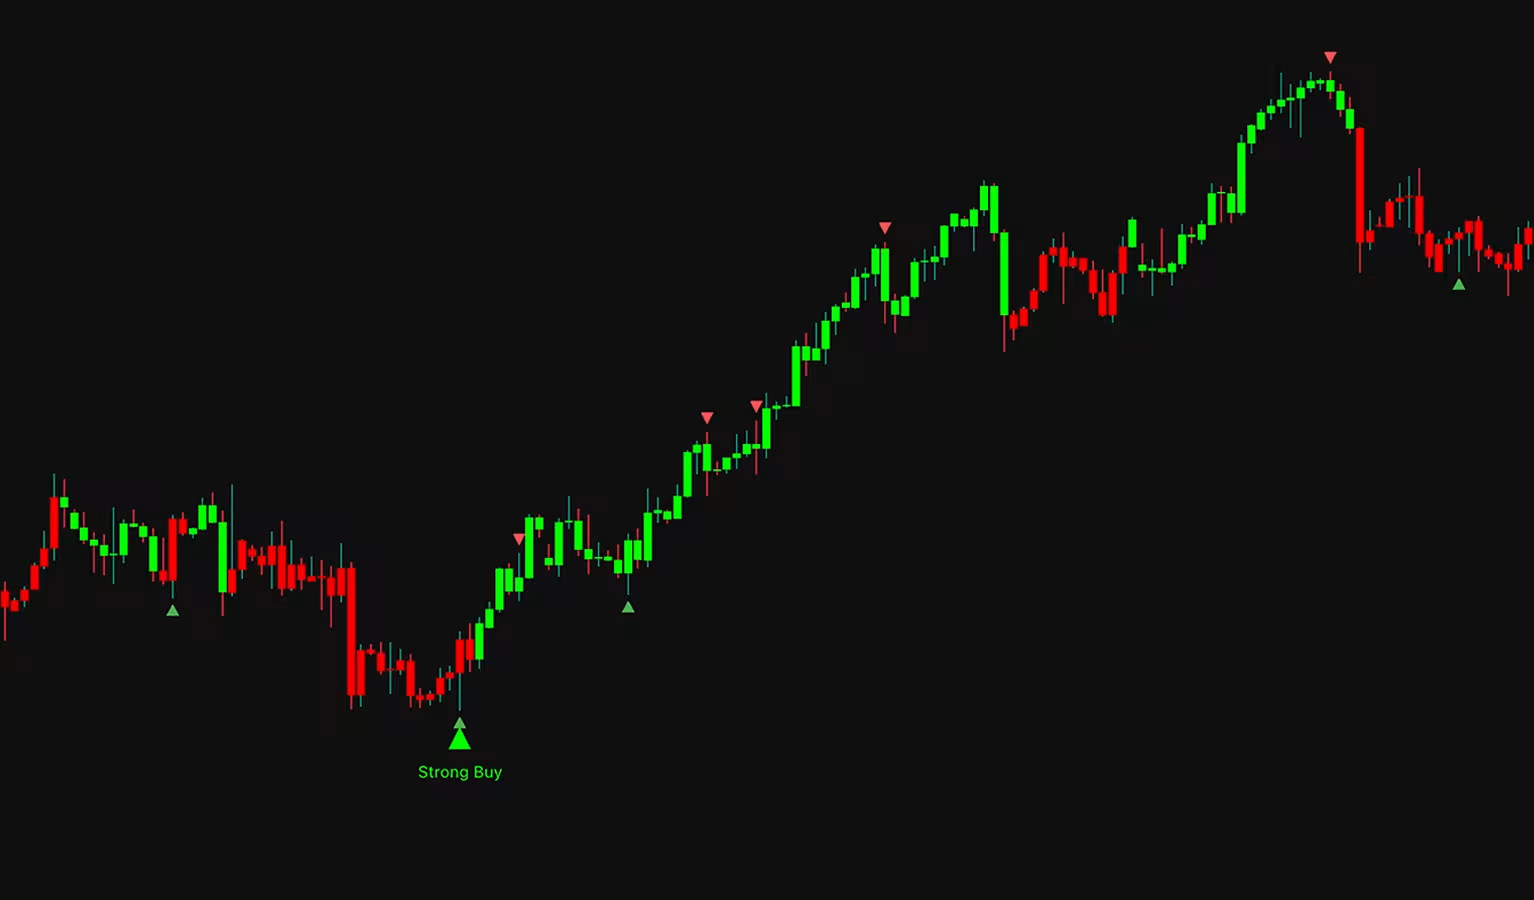
Swing Algo combines higher-timeframe trend analysis, directional filters, and EMA alignment. Tiered chart labels and pre-calculated planning levels provide context for reviewing a potential setup.
- Bar coloring — instant trend bias at a glance
- Two-tier chart labels — distinguish the two sets of configured conditions
- EMA filter for trend-aligned trade selection
- Pre-calculated TP1, TP2, TP3 displayed alongside setup labels
- Pre-calculated SL matched to the risk-reward profile
Scalper Strategy — Strategy Testing & Review
A TradingView strategy for exploring configured rules in Strategy Tester. Compare Pro-Trend and Contrarian modes, adjust TP/SL methods, and review historical simulations. Historical simulations are hypothetical and do not predict live results.
- Historical strategy testing — review simulated trades and compare settings
- Pro-Trend & Contrarian modes — strategy logic switch
- Advanced TP methods — percent-based or Donchian Channel
- Position-size and risk parameters for configuring strategy rules
Configure. Test. Review.
Choose a strategy mode and set your parameters.
Explore historical simulations in TradingView.
Compare settings and review the assumptions behind each test.
Workflow overview. Historical simulations do not predict live results.Reversal Finder — Review Potential Turning Points
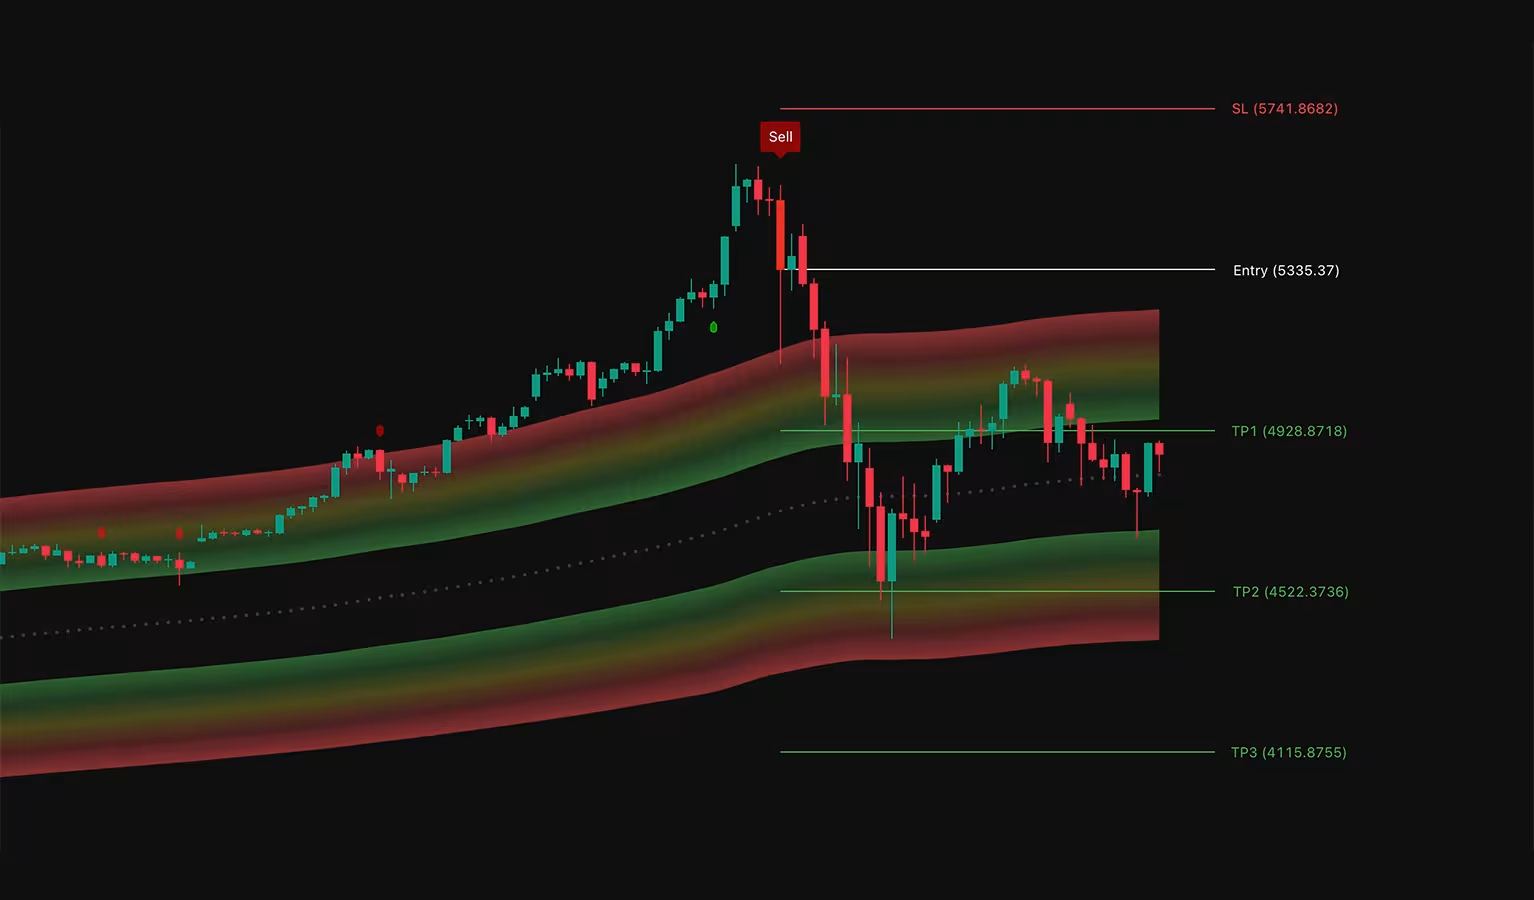
Reversal Finder uses dynamic volatility bands and configurable conditions to flag price extensions and potential turning points for review. These markers do not establish that a reversal will occur.
- Color-coded reversal bands — green / yellow / red overextension severity
- Dynamic bands that adjust in real time to current volatility
- Configurable sensitivity — independent buy & sell tuning
- Mean & deviation-based math to calculate the displayed bands
- Bar pattern analysis to highlight configured reversal conditions
Trend Pivot Oscillator
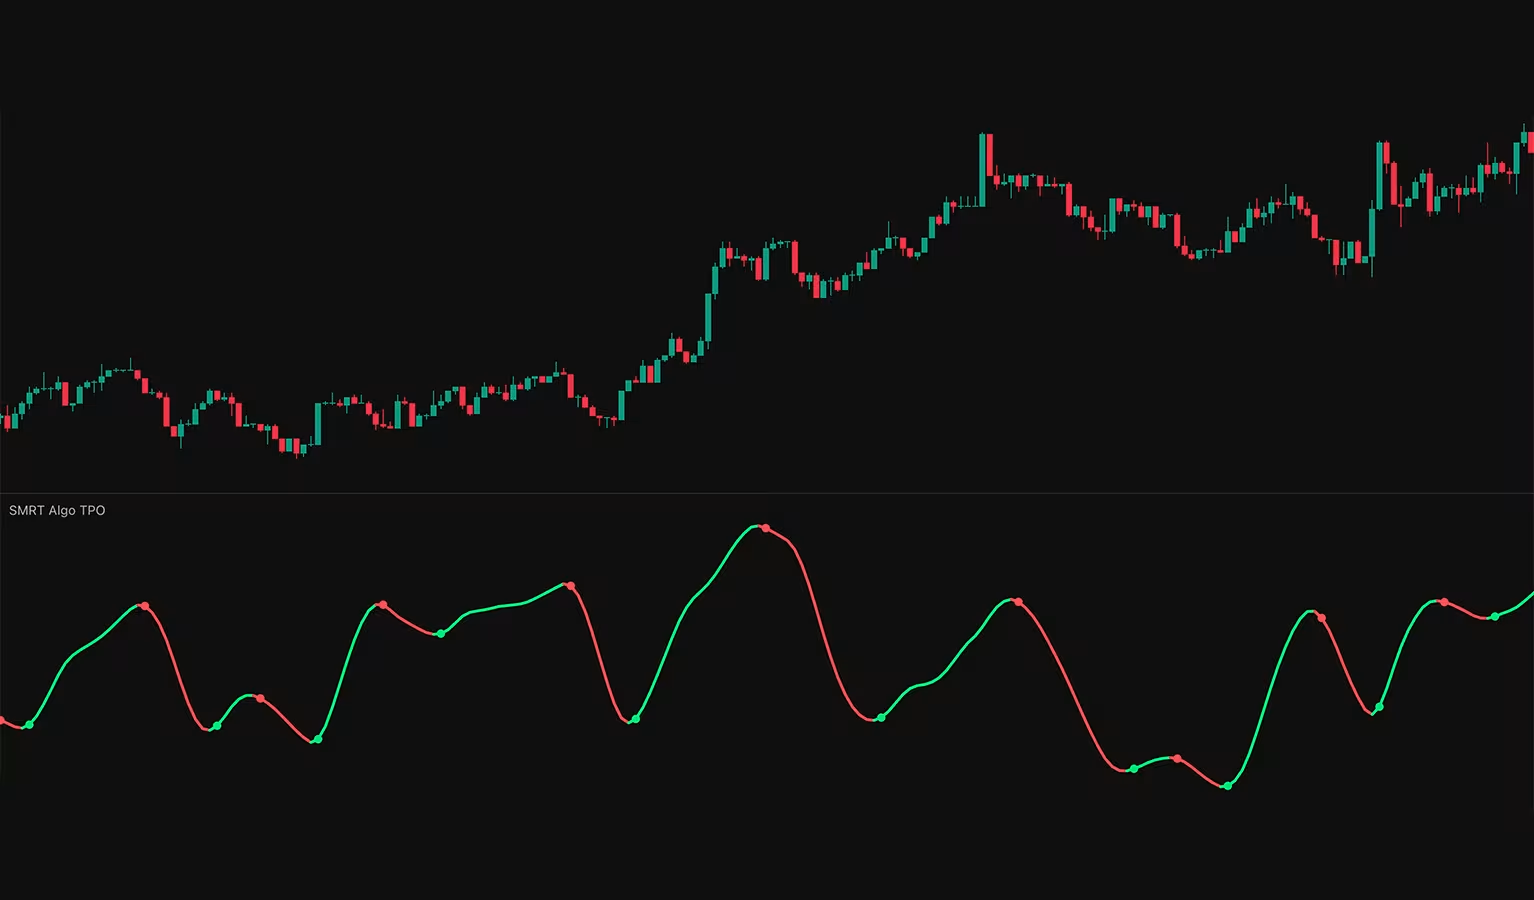
Trend Pivot Oscillator combines momentum analysis, pivot detection, and trend context to help you review pullbacks and changing chart conditions.
- Pivot-aware OB/OS detection — with trend context alongside the readings
- Green dots mark calculated oversold conditions
- Red dots mark calculated overbought conditions
- Pullback markers within the displayed trend context
- Pullback & consolidation detection for short-term reset points
MTF Supply & Demand
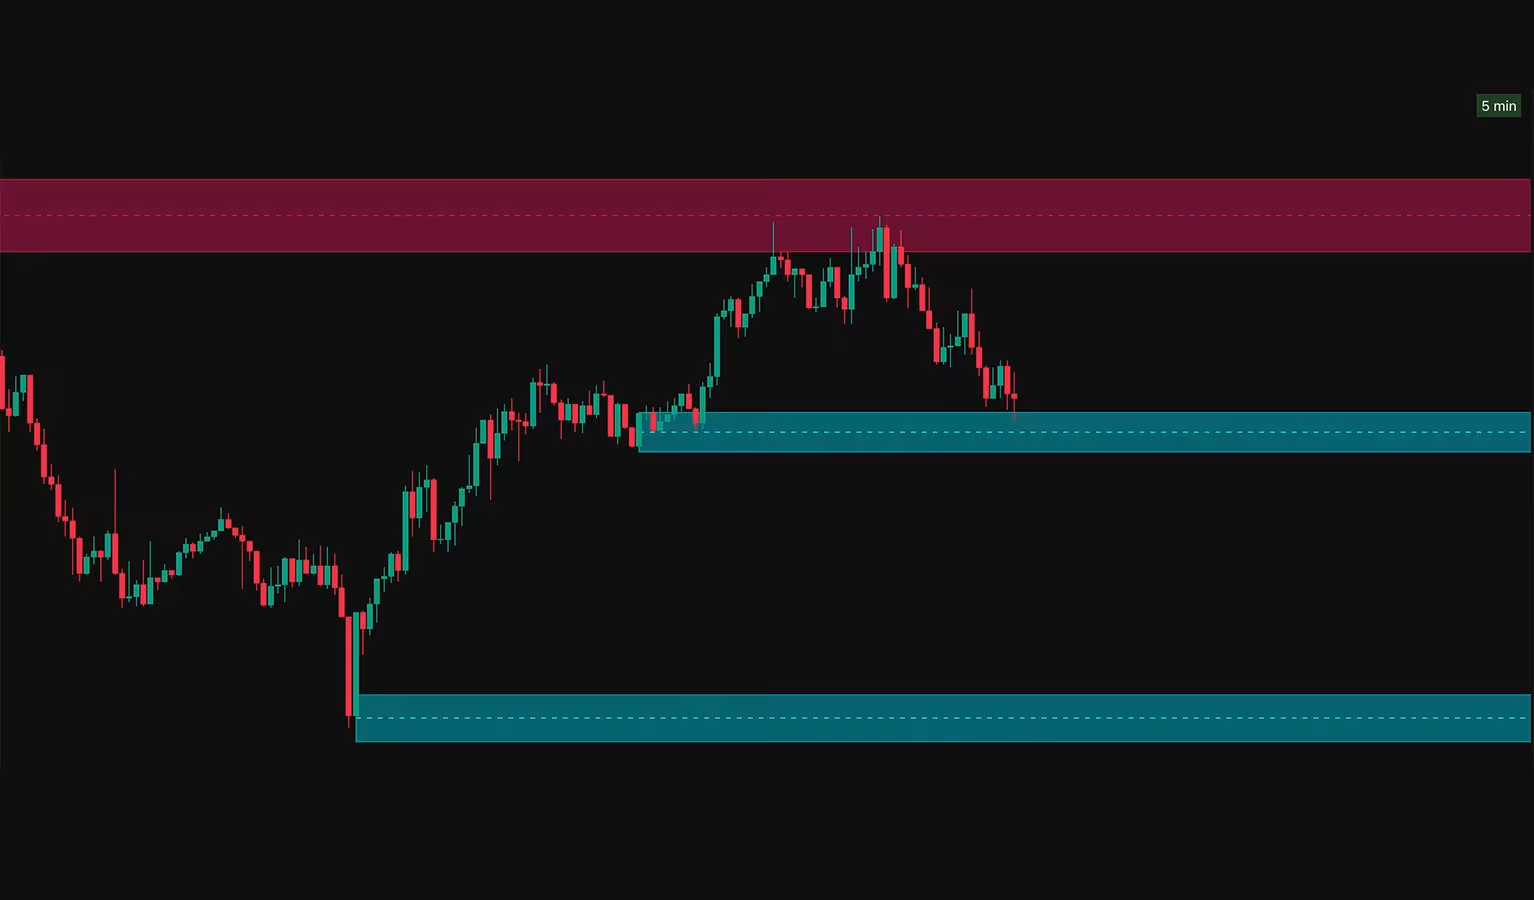
Renders higher-timeframe supply & demand zones on your active chart so you don't have to flip TFs. Pullback logic for clean zone detection, dynamic support/resistance, and built-in multi-level TP/SL outputs in one tool.
- Auto-highlighted supply & demand zones based on price-action logic
- Multi-timeframe display — see HTF zones on your active chart
- Customizable timeframe selection per indicator instance
- Dynamic S/R levels with multi-level TP/SL outputs
- Pullback logic for cleaner zone determination
- Real-time zone updates as new structure forms
Engineered To Work Together
Layers and tools that live across multiple indicators — the connective tissue that makes SMRT Algo a system rather than a script collection.
5 Engineering Filters
Noise · Gap · Range · Volatility · Trend. Pro V5 combines these filters to determine which configured conditions produce a chart label. Review the output alongside your own criteria.
5 Visual Overlays
Reversal Cloud · Sentiment Cloud · Price Steps · Market Bias ribbon · Pivot Flow. Optional decorations that surface trend intensity, sentiment, and pivots without cluttering the chart labels.
Multi-Timeframe Dashboards
Pro V5, Smart Money Toolkit, and the Screener all surface multi-timeframe agreement on a single chart — compare where timeframes align or differ before making your own decision.
Pre-Defined TP & SL
Pro V5, V1 Algo, Swing Algo, and MTF Supply & Demand display calculated stop and target levels beside the setup. Use them as references when assessing your own plan; they do not guarantee execution prices or limit losses.
Compatible TradingView Charts
Use the indicators on compatible TradingView charts. Check each tool's settings, timeframe guidance, and data requirements before adding it to your workflow.
Chart Alerts
Configure TradingView notifications for supported chart conditions. Choose the alerts relevant to your analysis and review the chart when a notification arrives. Available alert options depend on the tool and your TradingView plan.
14 Indicators. One Subscription.
One Connected Chart Workflow.
Choose a plan, connect your TradingView account, and follow the setup guide to add the toolkit to your charts.